
Banyan’s equity composite gained 7.8% year-to-date through June versus 6.2% for the S&P 500. Since the start of 2019, when yours truly officially took the helm, we have compounded at 14.0%per year versus 16.9% for the S&P 500. Please refer to our equity composite for details.
Our price-sensitive disposition is largely to blame for our relative sluggishness. From the start of 2019 through June of 2025, the most expensive stocks in the S&P 500 compounded at 19.3% per year.1 As shown below, the S&P 500’s valuation is now at Dot Com Bubble levels on many metrics.

Insurance Economics
Insurance has been at the heart of Banyan’s portfolio for decades. In fact, insurance is the lifeblood of our two largest and longest-held investments: Berkshire Hathaway (BRK) and Markel (MKL).BRK and MKL together accounted for 19.2% of our equity composite at quarter-end. Accordingly, it is worth sharing why we like the insurance business generally and these insurers specifically.
But let us begin with a disclaimer. While we know the insurance business fairly well, we know far less than those who have dedicated their lives to the business. They have forgotten more than we know. If you are such a person, and a few are regular readers of our letters, please send any critiques of this discussion to my email – destes@banyancapital.com. We appreciate your feedback.
Now for some insurance 101. Imagine that we start an insurance company with $1 million of equity after start-up costs. Our $1 million of equity is also policyholder “surplus” available to pay claims in excess of the premiums we charge. Our insurer’s economics will depend on the following:
- Gearing | How much insurance can we write with $1 million of surplus? We earn more premiums per dollar of surplus if we write more business, but this increases our “gearing.” Gearing is a form of leverage that amplifies the impact of underwriting results on surplus and equity. At 2x gearing, for instance, a 10% underwriting loss wipes out 20% of surplus and equity. Thus, gearing should fall as the range of potential underwriting results widens.
- Underwriting | How profitable will the insurance we write be? We cannot know ex ante. We must make predictions. If our predictions are too optimistic, our prices will not cover our costs. Conservatism is thus paramount. Underwriting margins are called a “combined ratio,” which is the cost of claims, commissions, etc. divided by premiums charged. If our combined ratio is 90%, then costs eat up 90¢ of every premium dollar while 10¢ is profit.
- Float | How much “float” will our insurer generate? Premiums are paid upfront, but it takes time for claims to occur and pay out. We invest this float in the interim. It is like borrowing at negative rates if our combined ratio is below 100%. If, for instance, our gearing is 2x and we generate $1 of float per $1 of premium, then policyholders “loan” us $2 for every$1 of surplus, and we pay negative 10% interest for the funds if our combined ratio is 90%.
- Investment | How productively will we invest our capital, including our surplus and float? Since surplus is used to absorb underwriting losses but underwriting losses should be rare, our surplus can be invested in productive but volatile assets like stocks. Float, meanwhile, must be invested in less productive and less volatile assets like bonds since it is used to pay claims. Float can be invested in more volatile assets, however, if surplus is excessive.
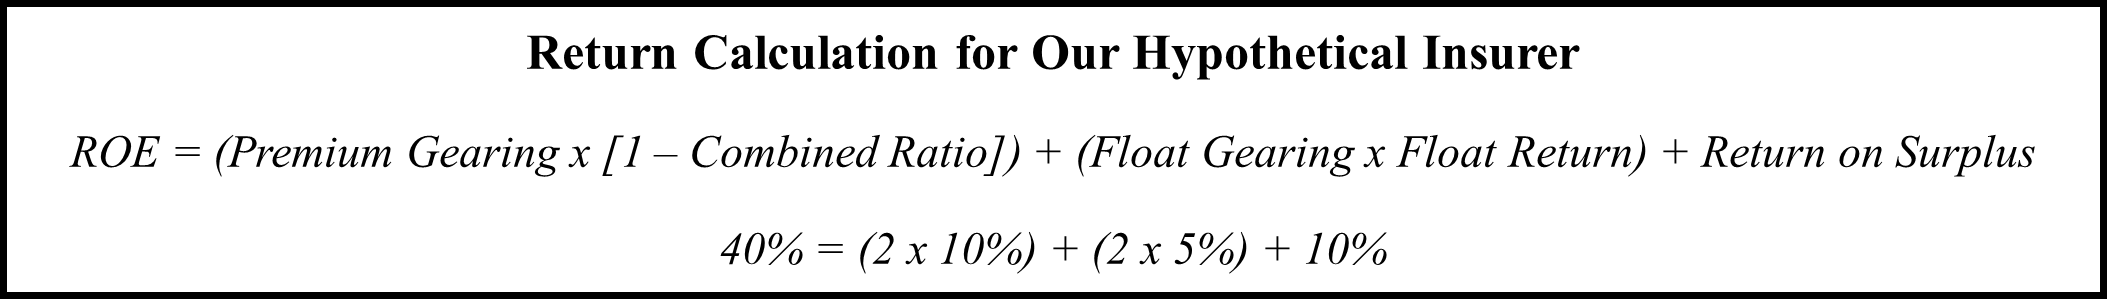
Now, let us make some rosy assumptions about our venture. If we write $2 of premium for every$1 of surplus (i.e., 2x gearing) at a combined ratio of 90%, we earn 20% on equity. If we generate$1 of float for every $1 of premium and invest in bonds yielding 5%, we earn 10% more on equity. Lastly, if we invest our surplus in stocks returning 10%, we earn another 10% on equity.
Moreover, underwriting results are not correlated with financial markets. Stocks, in other words, do not fall simply because a hurricane hits the Gulf Coast. Thus, our insurer can break even despite(1) an insured event that pushes our combined ratio up from 90% to 110% or (2) a 30% decline in stock prices. Insurers are therefore naturally hedged since their earning streams are uncorrelated.

An investment portfolio can thus compound more safely and at a higher rate if imbedded within a profitable insurance company. That is the beauty of BRK’s business model, and replicating BRK’s business model is MKL’s long-stated objective. Thus, the first attribute we look for in an insurer is an investment-oriented business model with an intelligent investor like Buffett at the helm.
The next attribute we look for is profitable underwriting over a cycle. Few insurers meet this test because the business is very competitive. Price and coverage are the key traits policyholders select for, and those traits are easy to replicate. Moreover, a thicket of agents and brokers stand between most insurers and their policyholders, and these intermediaries are well-informed. Thus, insurers sell undifferentiated promises to price-sensitive consumers through knowledgeable intermediaries.
Accordingly, there are virtually no barriers to entry, which makes underwriting profits both fleeting and cyclical. A profitable line of insurance attracts new competitors offering lower prices or better coverage. This competition erodes profits, and most insurers keep writing the line long after profits turn to losses. Smart insurers shrink, however, as the market “softens” (i.e., pricing becomes inadequate). A willingness to shrink in “softening” markets is the third attribute we look for.
Fourth, we look for conservative accounting. An insurer’s earnings are mere assumptions, after all, especially if the insurer writes “long-tail” lines with large “incurred but not reported” (or “IBNR”)claims. The habitual recognition of “favorable loss developments” is a good sign of conservatism. It means claims have been overestimated while earnings and book value have been understated.
We also prefer specialty property and casualty (or “P&C”) insurers. They write excess and surplus(or “E&S”) lines of insurance where markets, not politics, set prices and coverage. They avoid the “standardized” lines like home and auto that regulators lord over. Furthermore, niche expertise is needed to underwrite these lines, and intermediaries value staying power. The destructive force of new entry is therefore weaker, which makes it easier to earn underwriting profits over a cycle.
MKL is a classic example of what we look for in an insurer. It is a specialty P&C insurer writing esoteric lines like equine, vacant buildings, art, and antique cars. It also owns symbiotic businesses like State National, which sells “fronting” services to non-licensed insurers, and Nephila, which manages portfolios of “insurance linked securities” for institutional investors. Lastly, MKL’s $11.7 billion stock portfolio is managed by its CEO, Tom Gayner, who is an intelligent investor.
BRK is also a classic example of what we look for. In addition to owning specialty P&C insurers, BRK owns GEICO, which writes “standardized” lines. We usually dislike this sort of business, but GEICO is an exception. It was the first to disintermediate agents and brokers by selling directly to policyholders. This gave GEICO a durable cost advantage. Furthermore, GEICO generates a lot of float, which is very valuable in the hands of Buffett, the most intelligent investor of all.
In short, we like the insurance business but are selective. We want an investment-oriented business model and an intelligent investor at the helm. We also want consistent underwriting profits despite conservative accounting. Together, this ensures float is costless and employed most productively. Lastly, we prefer specialty P&C insurers protected by some barriers to entry. As BRK and MKL have illustrated, insurers with these attributes can build permanent wealth for decades.
Sincerely,
Drew Estes, CFA, JD
Portfolio Manager
See Other Resources
- S&P Global, S&P 500 Growth Index, available at: https://www.spglobal.com/spdji/en/indices/equity/sp-500-growth/?currency=USD&returntype=T-#overview.
Important Notice
You are now leaving the Banyan Capital Management website and will be entering the Charles Schwab & Co., Inc. (“Schwab”) website.
Schwab is a registered broker-dealer, and is not affiliated with Banyan Capital Management or any advisor(s) whose name(s) appear(s) on this website. Banyan Capital Management is/are independently owned and operated. Schwab neither endorses nor recommends Banyan Capital Management, unless you have been referred to us through the Schwab Advisor Network®. Regardless of any referral or recommendation, Schwab does not endorse or recommend the investment strategy of any advisor. Schwab has agreements with Banyan Capital Management under which Schwab provides Banyan Capital Management with services related to your account. Schwab does not review the Banyan Capital Management website(s), and makes no representation regarding information contained in the Banyan Capital Management website, which should not be considered to be either a recommendation by Schwab or a solicitation of any offer to purchase or sell any securities.
Continue to Website.svg)