

Banyan’s equity composite gained 0.5% through the third quarter versus the S&P 500’s gain of 12.7%. Since the start of 2019, when yours truly officially took the helm, we have compounded at 12.0% per year versus 17.3% for the S&P 500. Details on our equity composite can be found here.
Brief AI Update
We shared our opinion of the AI bubble in a previous letter. The risks have only grown since then. In six years, says a new paper out of Columbia University, over 16% of GDP must be spent on AI compute (and more on AI itself) for the capital being invested in data centers to earn a 15% return.1 This is fanciful. Yet, returns well above 15% seem to be priced into equity markets. Credit markets, meanwhile, have priced in a 20% chance that Oracle defaults on its data center debt in five years.2
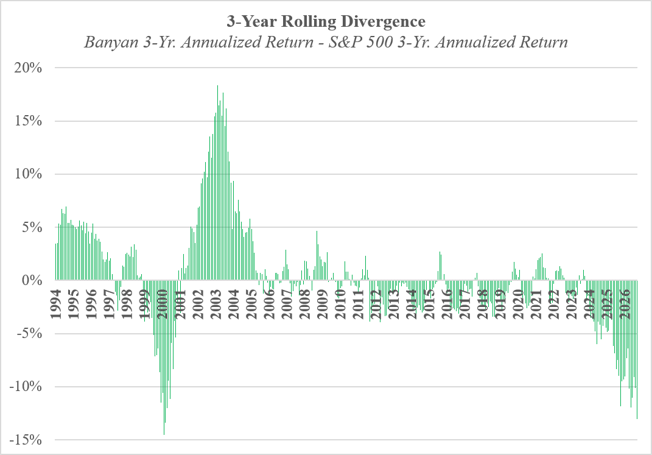
Our view aligns with credit markets, but we operate in equity markets. Hence our lackluster results. This was also true in the dot-com bubble, as shown below. We doubt this ends any differently.
Quantifying Business Quality
We can now turn to a topic with a longer shelf life. Why do we own what we own? We seek high-quality businesses trading at undemanding prices. Price is pretty straightforward. Quality, on the other hand, is in the eye of the beholder. Nobody admits to owning bad businesses, after all. How, then, can quality be quantified? Return on capital, we will argue, is the best measure.
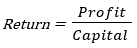
But there are many ways to measure a firm’s return on capital. Profit can be defined as net income, free cash flow, pre-tax or after-tax operating earnings, or a combination thereof. There are many ways to define capital as well. Is it equity, invested capital (i.e., equity plus debt), or tangible capital? Each method has shortcomings. Which is best depends on the question being asked.
For the question of business quality, we prefer return on tangible capital employed (or “ROTCE”). It speaks directly to business quality whereas other measures are distorted by financing decisions, tax rates, and past acquisitions. ROTCE is also what motivates entrepreneurial activity.

Imagine, for instance, that you raise $1 million to start a new firm that soon earns $500,000 in pre-tax operating profit. You clearly have a great business. It is earning a 50% ROTCE (i.e., $500,000 ÷ $1,000,000). The $1 million you raised is now worth $5 million if financiers require a 10% return on their money. It is worth even more if your firm can reinvest its earnings at 50% returns.
Now imagine buying the same firm for $5 million instead of starting it. The firm still employs the same $1 million of tangible capital it started with. ROTCE is thus the same. Your invested capital, however, is now $5 million versus $1 million had you started the firm. Accordingly, your return on invested capital (or “ROIC”) is now 10% (i.e., $500,000 ÷ $5,000,000) instead of 50%. Hence the issue with ROIC. It fell due to a decision unrelated to business quality.
Return on equity (or “ROE”) is also noisy. Imagine starting the firm with no debt. Tangible capital employed and equity both amount to $1 million. ROE and ROTCE both equal 50% ignoring taxes. If you borrowed half the money at 8% interest, however, then pre-tax ROE jumps to 92% (i.e., [$500,000 - $40,000] ÷$500,000) while ROTCE is still 50%. Hence the issue with ROE. We are asking about business quality. Financing decisions are a separate matter.
Entrepreneurs, moreover, chase ROTCE. Your firm’s 50% ROTCE is their chance to turn $1 bills into $5 of value. They rush into your market, replicate your product, and poach your customers. ROIC falling to 10% after the firm is sold does not dissuade them, and ROE rising to 92% because of debt does not encourage them. Those metrics may inform them, but ROTCE motivates them.
It is thus a powerful signal when a firm earns a high ROTCE year after year, and the firms we own certainly do. The software firms we bought this year, for instance, employ no tangible capital and, in turn, earn an infinite ROTCE. The ROTCE of our other holdings is 50% on average. Yet, our portfolio’s price-to-earnings ratio is only 11.7x. That combination builds permanent wealth.
As always, thank you for your trust in the Banyan team, and please call our office if you have any questions.
Sincerely,
Drew Estes, CFA, JD
See Other Resources
- Stijn Van Nieuwerburgh, Financing the AI Buildout, Columbia Business School (Oct. 2, 2026), pp. 5, 12, and 26-29, available at: https://papers.ssrn.com/sol3/papers.cfm?abstract_id=6444363 (the 16% figure reflects the 33% cash operating margin case in the paper’s appendix; we consider the author’s 50% base case too generous).
- Caleb Mutua et al., AI Borrowing Spree Hammers Tech Debt in Rush to Reprice Risk, Bloomberg (Oct. 8, 2026), available at: https://www.bloomberg.com/news/articles/2026-10-08/ai-debt-spree-hammers-tech-debt-as-traders-rush-to-reprice-risk.
Important Notice
You are now leaving the Banyan Capital Management website and will be entering the Charles Schwab & Co., Inc. (“Schwab”) website.
Schwab is a registered broker-dealer, and is not affiliated with Banyan Capital Management or any advisor(s) whose name(s) appear(s) on this website. Banyan Capital Management is/are independently owned and operated. Schwab neither endorses nor recommends Banyan Capital Management, unless you have been referred to us through the Schwab Advisor Network®. Regardless of any referral or recommendation, Schwab does not endorse or recommend the investment strategy of any advisor. Schwab has agreements with Banyan Capital Management under which Schwab provides Banyan Capital Management with services related to your account. Schwab does not review the Banyan Capital Management website(s), and makes no representation regarding information contained in the Banyan Capital Management website, which should not be considered to be either a recommendation by Schwab or a solicitation of any offer to purchase or sell any securities.
Continue to Website.svg)